DuckDB
NOTE
One of the notebooks the apps' Open Example Notebooks copies, shown with the outputs it saved when ganymede-ui last ran it. The notebook is in ganymede-ui.
DuckDB is an analytical SQL database. It runs in the notebook with no server: it reads CSV, JSON and Parquet files over HTTP and keeps tables in memory.
A first query
jupyter.sql runs SQL on an in-memory DuckDB database, written as a tagged template, and shows the result as a table. The first query loads DuckDB: its WebAssembly build from a CDN in the apps, its native build, @duckdb/node-api, on Node, Deno and Bun.
await jupyter.sql`select 'Ganymede' as moon, 2634.1 as radius_km, date '1610-01-07' as first_seen, version() as duckdb`;| moon string | radius_km number | first_seen date | duckdb string |
|---|---|---|---|
| Ganymede | 2634.1 | 1610-01-07 | v1.1.1 |
Query a file over HTTP
jupyter.sql.load makes a table from a file, guessing its columns' types. Here, four years of Seattle weather.
await jupyter.sql.load("seattle", "https://raw.githubusercontent.com/vega/vega-datasets/v2.11.0/data/seattle-weather.csv");
await jupyter.sql`describe seattle`;| column_name string | column_type string | null string | key string | default string | extra string |
|---|---|---|---|---|---|
| date | DATE | YES | |||
| precipitation | DOUBLE | YES | |||
| temp_max | DOUBLE | YES | |||
| temp_min | DOUBLE | YES | |||
| wind | DOUBLE | YES | |||
| weather | VARCHAR | YES |
await jupyter.sql`
  select year(date) as year,
         round(avg(temp_max), 1) as avg_high,
         round(sum(precipitation)) as rain_mm,
         count(*) filter (where weather = 'sun') as sunny_days
  from seattle
  group by year
order by year`;| year integer | avg_high number | rain_mm number | sunny_days integer |
|---|---|---|---|
| 2012 | 15.3 | 1226 | 118 |
| 2013 | 16.1 | 828 | 173 |
| 2014 | 17 | 1233 | 187 |
| 2015 | 17.4 | 1139 | 162 |
Parquet is read in ranges, so a query fetches only the columns and row groups it needs. This file holds every New York yellow cab trip of April 2019, 127 MB, but the query below reads two of its columns.
await jupyter.sql`
  select passenger_count as passengers, count(*) as trips
  from 'https://blobs.duckdb.org/data/taxi_2019_04.parquet'
  where passenger_count between 1 and 6
  group by passengers
order by passengers`;| passengers integer | trips integer |
|---|---|
| 1 | 5210818 |
| 2 | 1113704 |
| 3 | 317979 |
| 4 | 153369 |
| 5 | 313982 |
| 6 | 186408 |
Values from the notebook
A ${value} in the query is a value, never SQL: whatever it holds, it can't change the query.
const rainy = 10;
await jupyter.sql`
  select weather, count(*) as days
  from seattle
  where precipitation >= ${rainy}
  group by weather
order by days desc`;| weather string | days integer |
|---|---|
| rain | 136 |
| snow | 8 |
Data the notebook already has goes in with jupyter.sql.load too, as an array of objects. Here, the strongest earthquakes of the past week, from the US Geological Survey.
const feed = await (await fetch("https://earthquake.usgs.gov/earthquakes/feed/v1.0/summary/4.5_week.geojson")).json();
await jupyter.sql.load("quakes", feed.features.map((f: any) => ({
  magnitude: f.properties.mag,
  place: f.properties.place,
  depth_km: f.geometry.coordinates[2],
})));
await jupyter.sql`
  select case when depth_km < 70 then 'shallow' when depth_km < 300 then 'intermediate' else 'deep' end as depth,
         count(*) as quakes,
         max(magnitude) as strongest
  from quakes
  group by depth
order by min(depth_km)`;| depth string | quakes integer | strongest number |
|---|---|---|
| shallow | 84 | 6.4 |
| intermediate | 23 | 5.4 |
| deep | 7 | 5.1 |
Results into charts
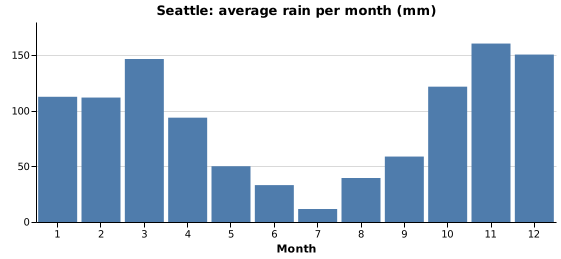
A result also has its rows as plain objects, ready for a chart. Monthly rain, from SQL to jupyter.chart:
const { rows } = await jupyter.sql`
  select month(date) as month, round(avg(precipitation) * 30, 1) as rain_mm
  from seattle group by month order by month`;
jupyter.chart({
  title: "Seattle: average rain per month (mm)",
  width: 520,
  height: 200,
  data: { values: rows },
  mark: { type: "bar", color: "#4f7cac" },
  encoding: {
    x: { field: "month", type: "ordinal", title: "Month", axis: { labelAngle: 0 } },
    y: { field: "rain_mm", type: "quantitative", title: null },
  },
});
Clean up
Closing the database frees its memory. Restarting the kernel does the same.
await jupyter.sql.close();